Thursday, June 25, 2015

Accurately Modeling Nanosecond Protein Dynamics Requires at least Microseconds of Simulation

Gregory R. Bowman Journal of Computational Chemistry 2015
Contributed by +Jan Jensen

This papers compares computed and experimental order parameters for two proteins, ubiquitin and RNase H, computed using 10, 100, 1000, and 10000 ns (10 $\mu$s) explicit molecular dynamics simulations.

Order parameters quantify the order of particular bonds (typically amide NH and methyl CH) and are typically measured via relaxation-dispersion NMR experiments that are insensitive to dynamics longer than the molecular tumbling time.  For ubiquitin and RNase H the tumbling times are 3.5 and 8.5 ns, respectively so the usual assumption would be that a 100 ns simulation is more than enough for both cases.

Figure 3. Correlation coefficients (r) and RMSDs between experimental backbone order parameters for RNase H and those calculated from simulations with the Amber03 force field. Mean values from 50 bootstrapped samples are shown as a function of the simulation length for the long-time limit approximation (open diamonds) and from the truncated average approximation (closed circles). The error bars represent one standard deviation. (c) 2015 John Wiley and Sons. Reproduced with permission.
Bowman shows that this assumption is not good.  For example, for RNase H (Figure 3 from the paper), 100 ns is barely adequate (especially for r) and a 1 $\mu$s simulation is a minimum requirement to demonstrate convergence. As Bowman points out:
Since order parameters are an ensemble average, they have contributions from all populated states, including those separated from the native state by high-energy barriers, which are unlikely to be accessed during nanoseconds of simulation. 
Using Amber99sb-ILDN and Charmm27 results in similar conclusions. The fact that the agreement with experiment continues to improve as as the length of the simulation increases also suggests that modern force fields predict that the experimentally observed protein structure is in fact a minimum of the free energy surface, which has not always been the case in the past.


This work is licensed under a Creative Commons Attribution 4.0

Tuesday, June 23, 2015

A Practicable Real-Space Measure and Visualization of Static Electron-Correlation Effects

Grimme, S. and Hansen, A., Angew Chem Int Edit, (2015)
Contributed by Tobias Schwabe

The question of how to deal with multireference (MR) cases in DFT has a longstanding history. Of course, the exact functional would also include multireference effects (or non-dynamical/non-local/static electron correlaton, as these effects are also called) and no special care is needed. But when it comes to today's density functional approximations (DFAs) within the Kohn-Sham framework, everything is a little bit more complicated. For example, Baerends and co-workers have shown that is the exchange part in GGA-DFAs that actually accounts for static electron correlation.[1] These studies, among others, led to the conclusion that the (erroneous) electron self-interaction in DFAs accounts for some of the MR character in a system. A good review about how these things are interconnected can be found in Ref. [2].

Instead of searching for better and better DFAs, another approach to the problem is to apply ensemble DFT which introduces the free electron energy and also the concept of entropy into DFT.[3] The key concept here is to allow for fractional occupation numbers in Kohn-Sham orbitals and to look at the system at T > 0 K. In case of systems with MR character which cannot be described with a single Slater determinant fractional occupation will result (for e.g. when computing natural occupation numbers). The interesting thing about ensemble DFT is that it allows to find these numbers directly via a variational approach without computing an MR wavefunction first.

Grimme and Hansen now turned this approach into a tool for a qualitative analysis of molecular systems. They do so by plotting what they call the fractional orbital density (FOD). That is, only those molecular orbitals with non-integer occupation numbers contribute to the density – and only at a finite temperature. This density vanishes completely at T = 0 K. So, the analysis literally shows MR hot spots. Integrating the FOD yields also an absolute scalar which allows to quantify the MR character and to compare different molecules. Due to the authors, this value correlates well with other values which attempts to provide such information.

A great advantage of the approach is that now the MR character can be located (geometrically) within the molecule. The findings presented in the application part of the paper go along well with chemical intuition. The analysis might help to visualize and to interpret MR phenomenon. The tool can provide insight when the nature of the electronic structure is not obvious – for example, when dealing with biradicals in a singlet spin state. It might also be a good starting point to identify relevant regions/orbitals which should be included when one wants to treat a system on a higher level than DFT, for example with WFT-in-DFT based on projector techniques. Last but not least, it can help to identify chemical systems to which standard DFAs should not (or only with great care) be applied.

References:

[1] a) O. V. Grittsenko, P. R. T. Schipper, and E. J. Baerends, J. Chem. Phys. (1997), 107, 5007 b) P. R. T. Schipper, O. V. Grittsenko, and E. J. Baerends, Phys. Rev. A (1998), 57, 1729 c) P. R. T. Schipper, O. V. Grittsenko, and E. J. Baerends, J. Chem. Phys. (1999), 111, 4056

[2] A. J. Cohen, P. Mori-Sánchez, and W. Yang., Chem. Rev. (2012), 112, 289

[3] R. G. Parr and W. Yang, Density-Functional Theory of Atoms and Molecules, Oxford University Press (1989)


Thursday, June 18, 2015

Ring Planarity Problem of 2-Oxazoline Revisited Using Microwave Spectroscopy and Quantum Chemical Calculations

Samdal, S.; Møllendal, H.; Reine, S.; Guillemin, J.-C. J. Phys. Chem. A 2015, 119, 4875–4884
Contributed by Steven Bachrach.
Reposted from Computational Organic Chemistry with permission

A recent reinvestigation of the structure of 2-oxazoline demonstrates the difficulties that many computational methods can still have in predicting structure.

Samdal, et al. report the careful examination of the microwave spectrum of 2-oxzoline and find that the molecule is puckered in the ground state.1 It’s not puckered by much, and the barrier for inversion of the pucker, through a planar transition state is only 49 ± 8 J mol-1. The lowest vibrational frequency in the non-planar ground state, which corresponds to the puckering vibration, has a frequency of 92 ± 15 cm-1. This low barrier is a great test case for quantum mechanical methodologies.

And the outcome here is not particularly good. HF/cc-pVQZ, M06-2X/cc-pVQZ, and B3LYP/cc-pVQZ all predict that 2-oxazoline is planar. More concerning is that CCSD and CCSD(T) with either the cc-pVTZ or cc-pVQZ basis sets also predict a planar structure. CCSD(T)-F12 with the cc-pVDZ predicts a non-planar ground state with a barrier of only 8.5 J mol-1, but this barrier shrinks to 5.5 J mol-1 with the larger cc-pVTZ basis set.

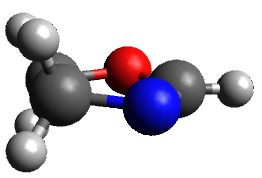
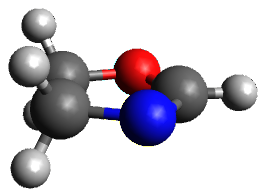
The only method that has good agreement with experiment is MP2. This method predicts a non-planar ground state with a pucker barrier of 11 J mol-1 with cc-pVTZ, 39.6 J mol-1 with cc-pVQZ, and 61 J mol-1with the cc-pV5Z basis set. The non-planar ground state and the planar transition state of 2-oxazoline are shown in Figure 1. The computed puckering vibrational frequency does not reproduce the experiment as well; at MP2/cc-pV5Z the predicted frequency is 61 cm-1 which lies outside of the error range of the experimental value.

Non-planar

Planar TS
Figure 1. MP2/cc-pV5Z optimized geometry of the non-planar ground state and the planar transition
state of 2-oxazoline.

References

(1) Samdal, S.; Møllendal, H.; Reine, S.; Guillemin, J.-C. "Ring Planarity Problem of 2-Oxazoline Revisited Using Microwave Spectroscopy and Quantum Chemical Calculations," J. Phys. Chem. A 2015119, 4875–4884, DOI: 10.1021/acs.jpca.5b02528.

InChIs

2-oxazoline: InChI=1S/C3H5NO/c1-2-5-3-4-1/h3H,1-2H2
InChIKey=IMSODMZESSGVBE-UHFFFAOYSA-N


This work is licensed under a Creative Commons Attribution-NoDerivs 3.0 Unported License.

Wednesday, June 3, 2015

Charge-Enhanced Acidity and Catalyst Activation

Samet, M.; Buhle, J.; Zhou, Y.; Kass, S. R. J. Am. Chem. Soc. 2015, 137, 4678-4680 
Contributed by Steven Bachrach.
Reposted from Computational Organic Chemistry with permission

Kass and coworkers looked at a series of substituted phenols to tease out ways to produce stronger acids in non-polar media.1 First they established a linear relationship between the vibrational frequency shifts of the hydroxyl group in going from CCl4 as solvent to CCl4 doped with 1% acetonitrile with the experimental pKa in DMSO. They also showed a strong relationship between this vibrational frequency shift and gas phase acidity (both experimental and computed deprotonation energies).

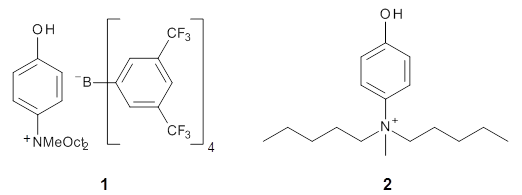
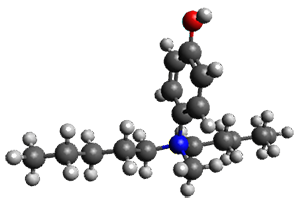
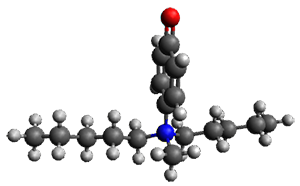
A key recognition was that a charged substituent (like say ammonium) has a much larger effect on the gas-phase (and non-polar solvent) acidity than on the acidity in a polar solvent, like DMSO. This can be attributed to the lack of a medium able to stable charge build-up in non-polar solvent or in the gas phase. This led them to 1, for which B3LYP/6-31+G(d,p) computations of the analogous dipentyl derivative 2 (see Figure 1) indicated a deprotonation free energy of 261.4 kcal mol-1, nearly 60 kcal mol-1 smaller than any other substituted phenol they previously examined. Subsequent measurement of the OH vibrational frequency shift showed the largest shift, indicating that 1 is extremely acidic in non-polar solvent.


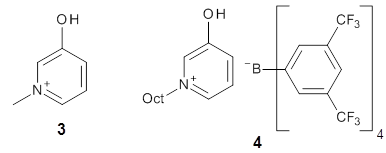
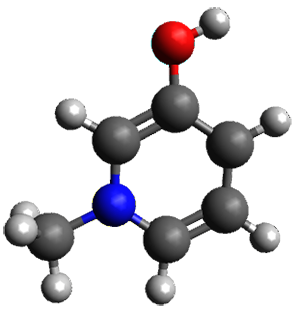
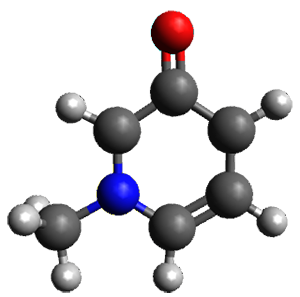
Further computational exploration led to 3 (see Figure 1), for which computations predicted an even smaller deprotonation energy of 231.1 kcal mol-1. Preparation of 4 and experimental observation of its vibrational frequency shift revealed an even larger shift than for 1, making 4 extraordinarily acidic.


2

Conjugate base of 2


3


Conjugate base of 3
Figure 1. B3LYP/6-31+G(d,p) optimized geometries of 2 and 3 and their conjugate bases.


Reference

(1) Samet, M.; Buhle, J.; Zhou, Y.; Kass, S. R. "Charge-Enhanced Acidity and Catalyst Activation," J. Am. Chem. Soc. 2015137, 4678-4680, DOI: 10.1021/jacs.5b01805.


InChI

1 (cation only): InChI=1S/C23H41NO/c1-4-6-8-10-12-14-20-24(3,21-15-13-11-9-7-5-2)22-16-18-23(25)19-17-22/h16-19H,4-15,20-21H2,1-3H3/p+1
InChIKey=HIQMXPFMEWRQQG-UHFFFAOYSA-O
2InChIKey=WMOPRSHYZNVZKF-UHFFFAOYSA-O
3: InChI=1S/C6H7NO/c1-7-4-2-3-6(8)5-7/h2-5H,1H3/p+1
InChIKey=FZVAZYLFYPULKX-UHFFFAOYSA-O
4 (cation only): InChI=1S/C13H21NO/c1-2-3-4-5-6-7-10-14-11-8-9-13(15)12-14/h8-9,11-12H,2-7,10H2,1H3/p+1
InChIKey=HSFRKOBOATYXAH-UHFFFAOYSA-O


This work is licensed under a Creative Commons Attribution-NoDerivs 3.0 Unported License.